Understanding your Sales dashboard
Daily, weekly, monthly, and strategic sales numbers, all in one live view.
Go to Sales BI — on screen this is titled "CEO Executive Dashboard," since it's built for a fast, top-level read of how sales are doing, but it's scoped entirely to sales and transactions (for the all-module version, see Understanding the CEO/executive dashboard).
Looking for the page with revenue trend charts, targets, and customer breakdowns instead? That's a different screen — see Understanding the Sales BI Dashboard.
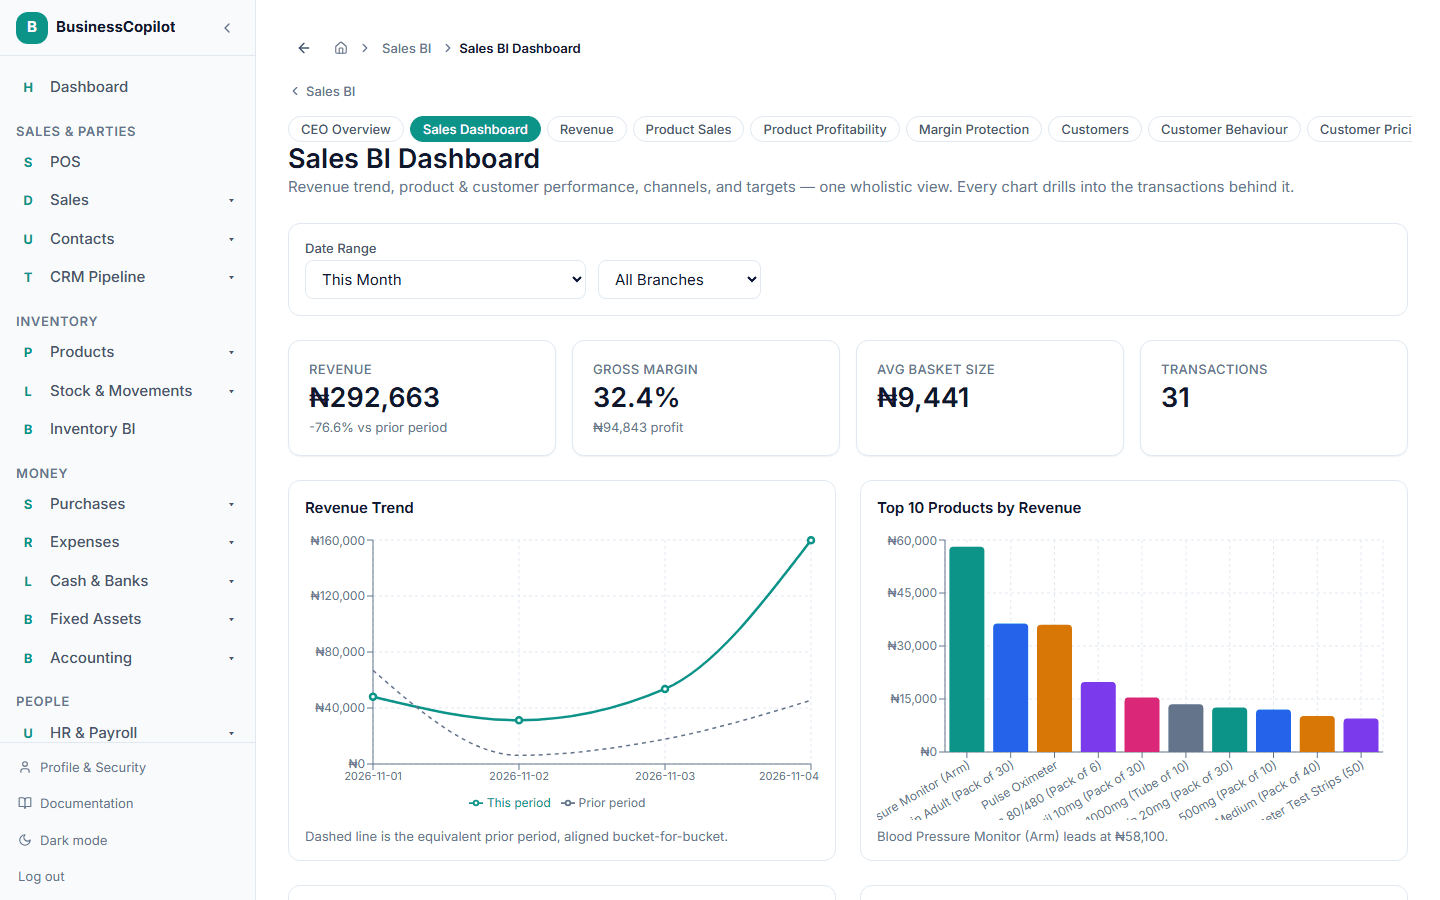
What you're looking at
The numbers are grouped into four views:
- Daily — how today (or a chosen day) is going.
- Weekly — this week's trend.
- Monthly — the bigger picture for the month.
- Strategic — longer-term patterns worth knowing about.
Alongside the numbers, the Daily view shows your top products for the day at a glance.
For a number you want to dig into further — with a real drill-down into the transactions behind it — see Drilling into a number. For trend charts, targets, and a deeper read on customer and product behavior, see Understanding the Sales BI Dashboard.