Understanding the Sales BI Dashboard
One page for revenue trend, top products, targets, and customer behavior — with drill-down and export built in.
Go to Sales BI → Sales BI Dashboard. This is a different screen from Understanding your Sales dashboard (the one titled "CEO Executive Dashboard" on screen) — see the note at the bottom of this page if you're not sure which one you're looking for.
What you're looking at
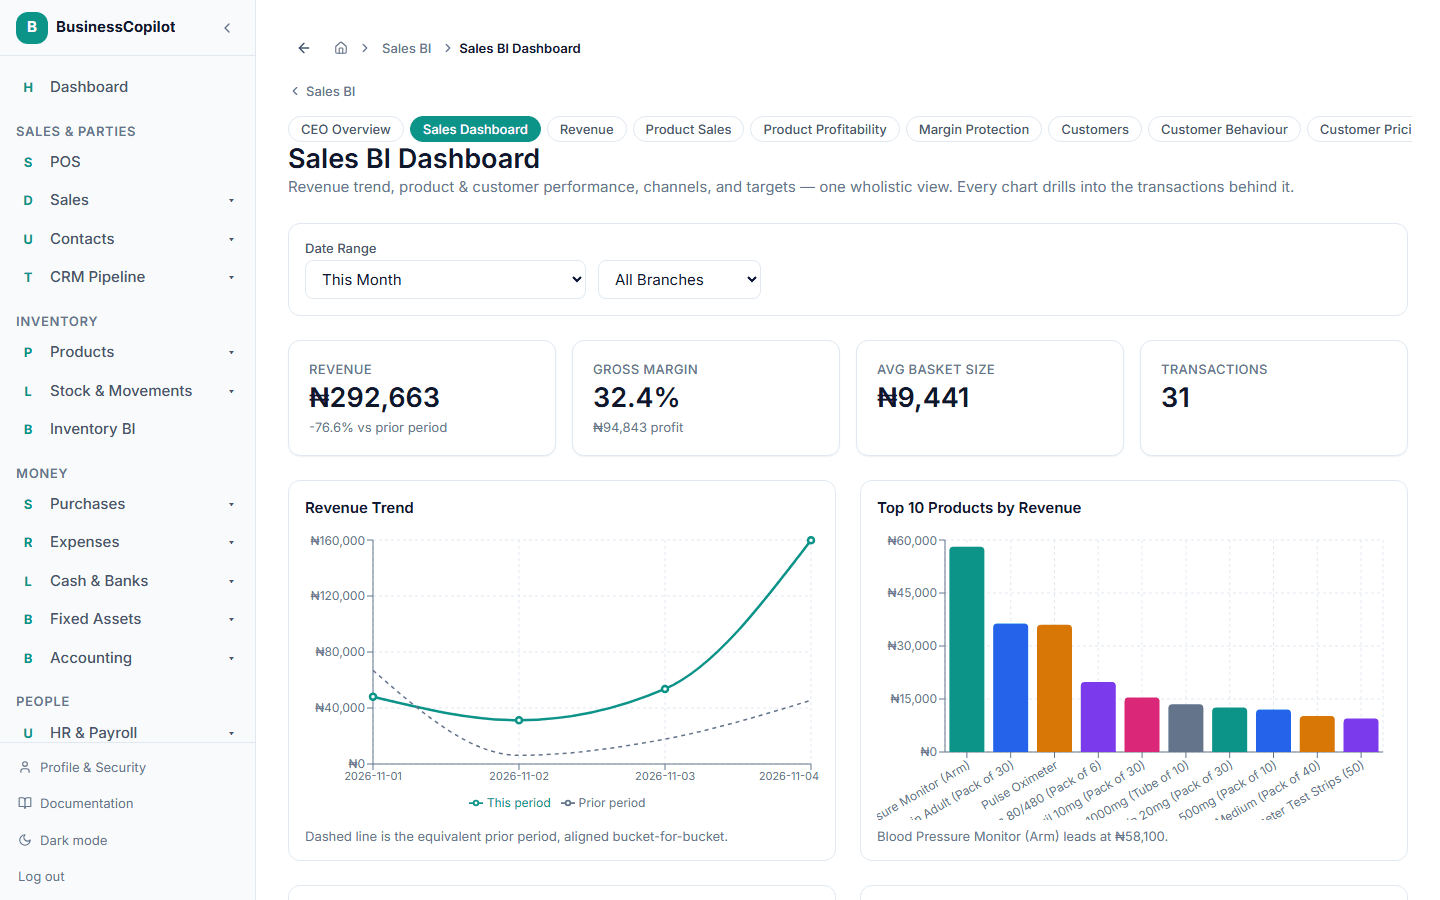
The page is built to answer "how are we doing, and why" in one scroll, starting with the most important numbers and getting more detailed as you go down.
At the top:
- Revenue, paired with Gross Margin right next to it — so a good revenue number is never read on its own without knowing whether it was actually profitable.
- Average Basket Size and Transactions for the period you've selected.
Above the fold — the two charts you'll check most:
- Revenue Trend — a line for the period you've selected, with a second, dashed line showing the same length of time before it, so you can see at a glance whether you're ahead of or behind where you were.
- Top Products by Revenue — your best-selling products, ranked, for the same period.
Profitability over time:
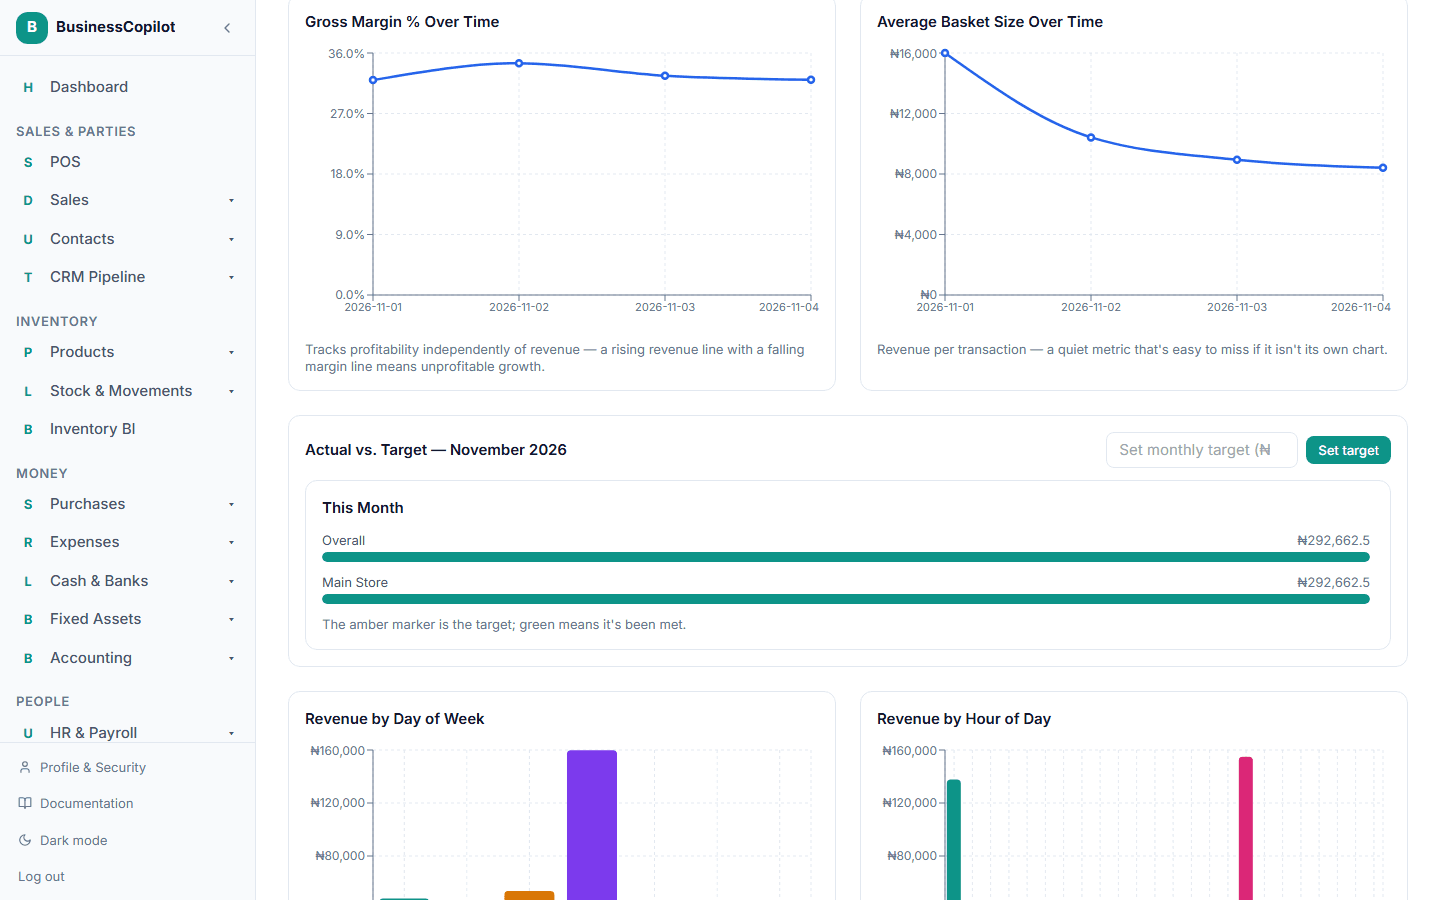
- Gross Margin % Over Time and Average Basket Size Over Time — both as their own trend lines, so a slipping margin or a shrinking basket doesn't stay hidden behind a healthy-looking revenue number.
Targets:
- Actual vs. Target for the current month — a bar for each location (or salesperson, if that's how your business tracks it) showing what's actually come in against what was set as the goal, with a marker showing where the target sits. An Owner or Manager can set a monthly revenue target for the whole business or for a specific location right from this section — see Setting a monthly sales target below.
Further down — patterns and composition:
- Revenue by Day of Week and Revenue by Hour of Day — useful for staffing and promotion timing (for example, seeing that Fridays and evenings consistently outsell the rest of the week).
- Revenue by Category Over Time — which product categories are driving revenue, and how that mix is shifting.
- New vs. Returning Customers and Revenue by Loyalty Tier — how much of your revenue comes from repeat customers versus first-time buyers.
- Revenue by Payment Method — your cash, card, and transfer mix.
- Returns by Reason and Returns by Product — catches problems (a bad batch, a pricing mistake) early, before they show up as a bigger loss.
Every chart drills down
Select a bar, a slice, or a row on any of these charts to open a full page listing the real sales behind that number — see Drilling into a number.
Filtering by date range and location
Like most reports, you can narrow this page to a date range and, if you have more than one location, filter it down to a single one using the controls at the top of the page.
Setting a monthly sales target
If you're an Owner or Manager, you can set a revenue goal for a month directly from the Actual vs. Target section:
- Enter an amount in the Set monthly target field.
- Select Set target.
You can set one target for the whole business, or a separate target per location. Once set, the bar for that month shows your actual revenue against it, with a marker for the target itself — green once you've met it.
Which "sales dashboard" am I looking for?
BusinessCopilot has two different sales-focused overview screens, and their names overlap:
- Understanding your Sales dashboard (here) — on screen titled "CEO Executive Dashboard," organized into Daily/Weekly/Monthly/Strategic groupings. Good for a fast, top-level check.
- The Sales BI Dashboard (this page) — one continuous page built around trend charts, targets, and customer/product breakdowns, with drill-down on every chart. Good for understanding why the numbers look the way they do.