Building a custom report
Choose exactly what you want to see, filter it, and save it to run again anytime.
If none of the pre-built reports in the Report Library show quite what you need, build your own. Reports → Custom Report Builder and Reports → Report Library link to each other, so you can jump between browsing pre-built reports and building your own without hunting for either.
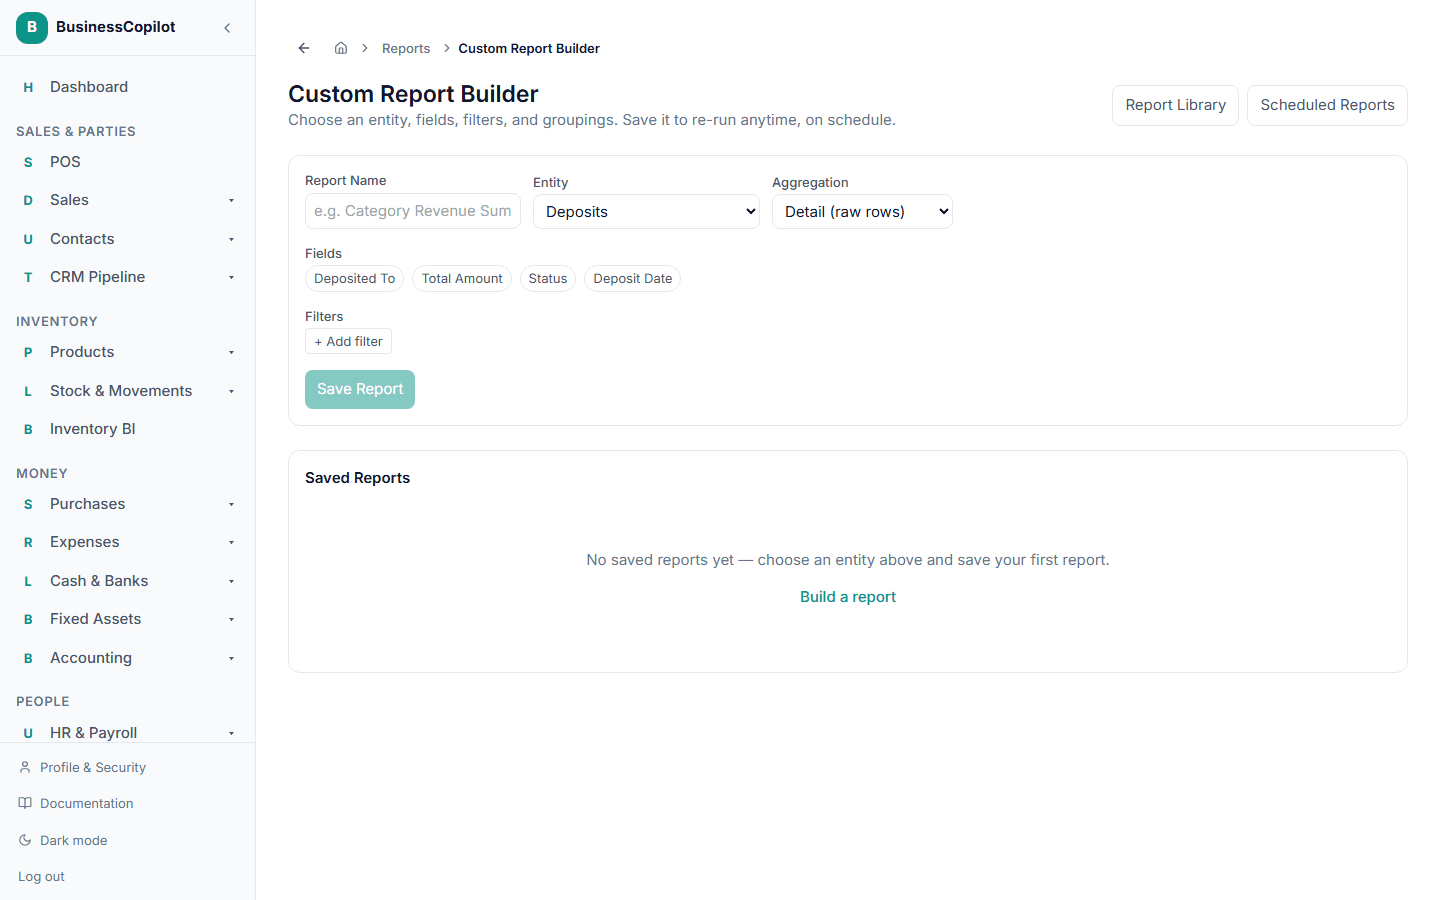
- Go to Reports → Custom Report Builder.
- Choose the entity you want to report on (e.g. Sales, Products).
- Pick which fields to include.
- Add filters — for example, only rows where a field equals, doesn't equal, is greater than, or contains a value you choose.
- If you want totals instead of a raw list, switch to summary and choose what to group by.
- Give it a name and save it.
Once saved, select it any time to run it fresh against a date range you pick — it always pulls current data, not a snapshot from when you built it.
Margin and stock value on Products
Reporting on the Products entity gives you Margin (selling price minus cost price), Margin %, and Stock Value (Cost) (stock on hand × cost price) as fields, alongside the usual price/cost/stock fields — useful for an at-a-glance view of profitability and tied-up capital without needing any sales data.
This is deliberately not called "Profit" — a product sitting in inventory hasn't sold anything yet, so this is only a potential margin off current list price/cost. For actual profit realized from sales, report on Sale Line Items instead (it has its own real Profit field, computed from what things actually sold for) — grouped by Product, this gives you true per-product profitability. The Builder shows a reminder of this right on the page whenever you pick Products as the entity.
Viewing a report as a chart
If your report is set to Summary (grouped) with at least one Group By field, a Table / Chart toggle appears above the results — switch to Chart for a quick bar-chart view of the same numbers. Detail (raw rows) reports don't get this toggle, since a raw row list has no single value to chart.
Pinning a report to your Dashboard
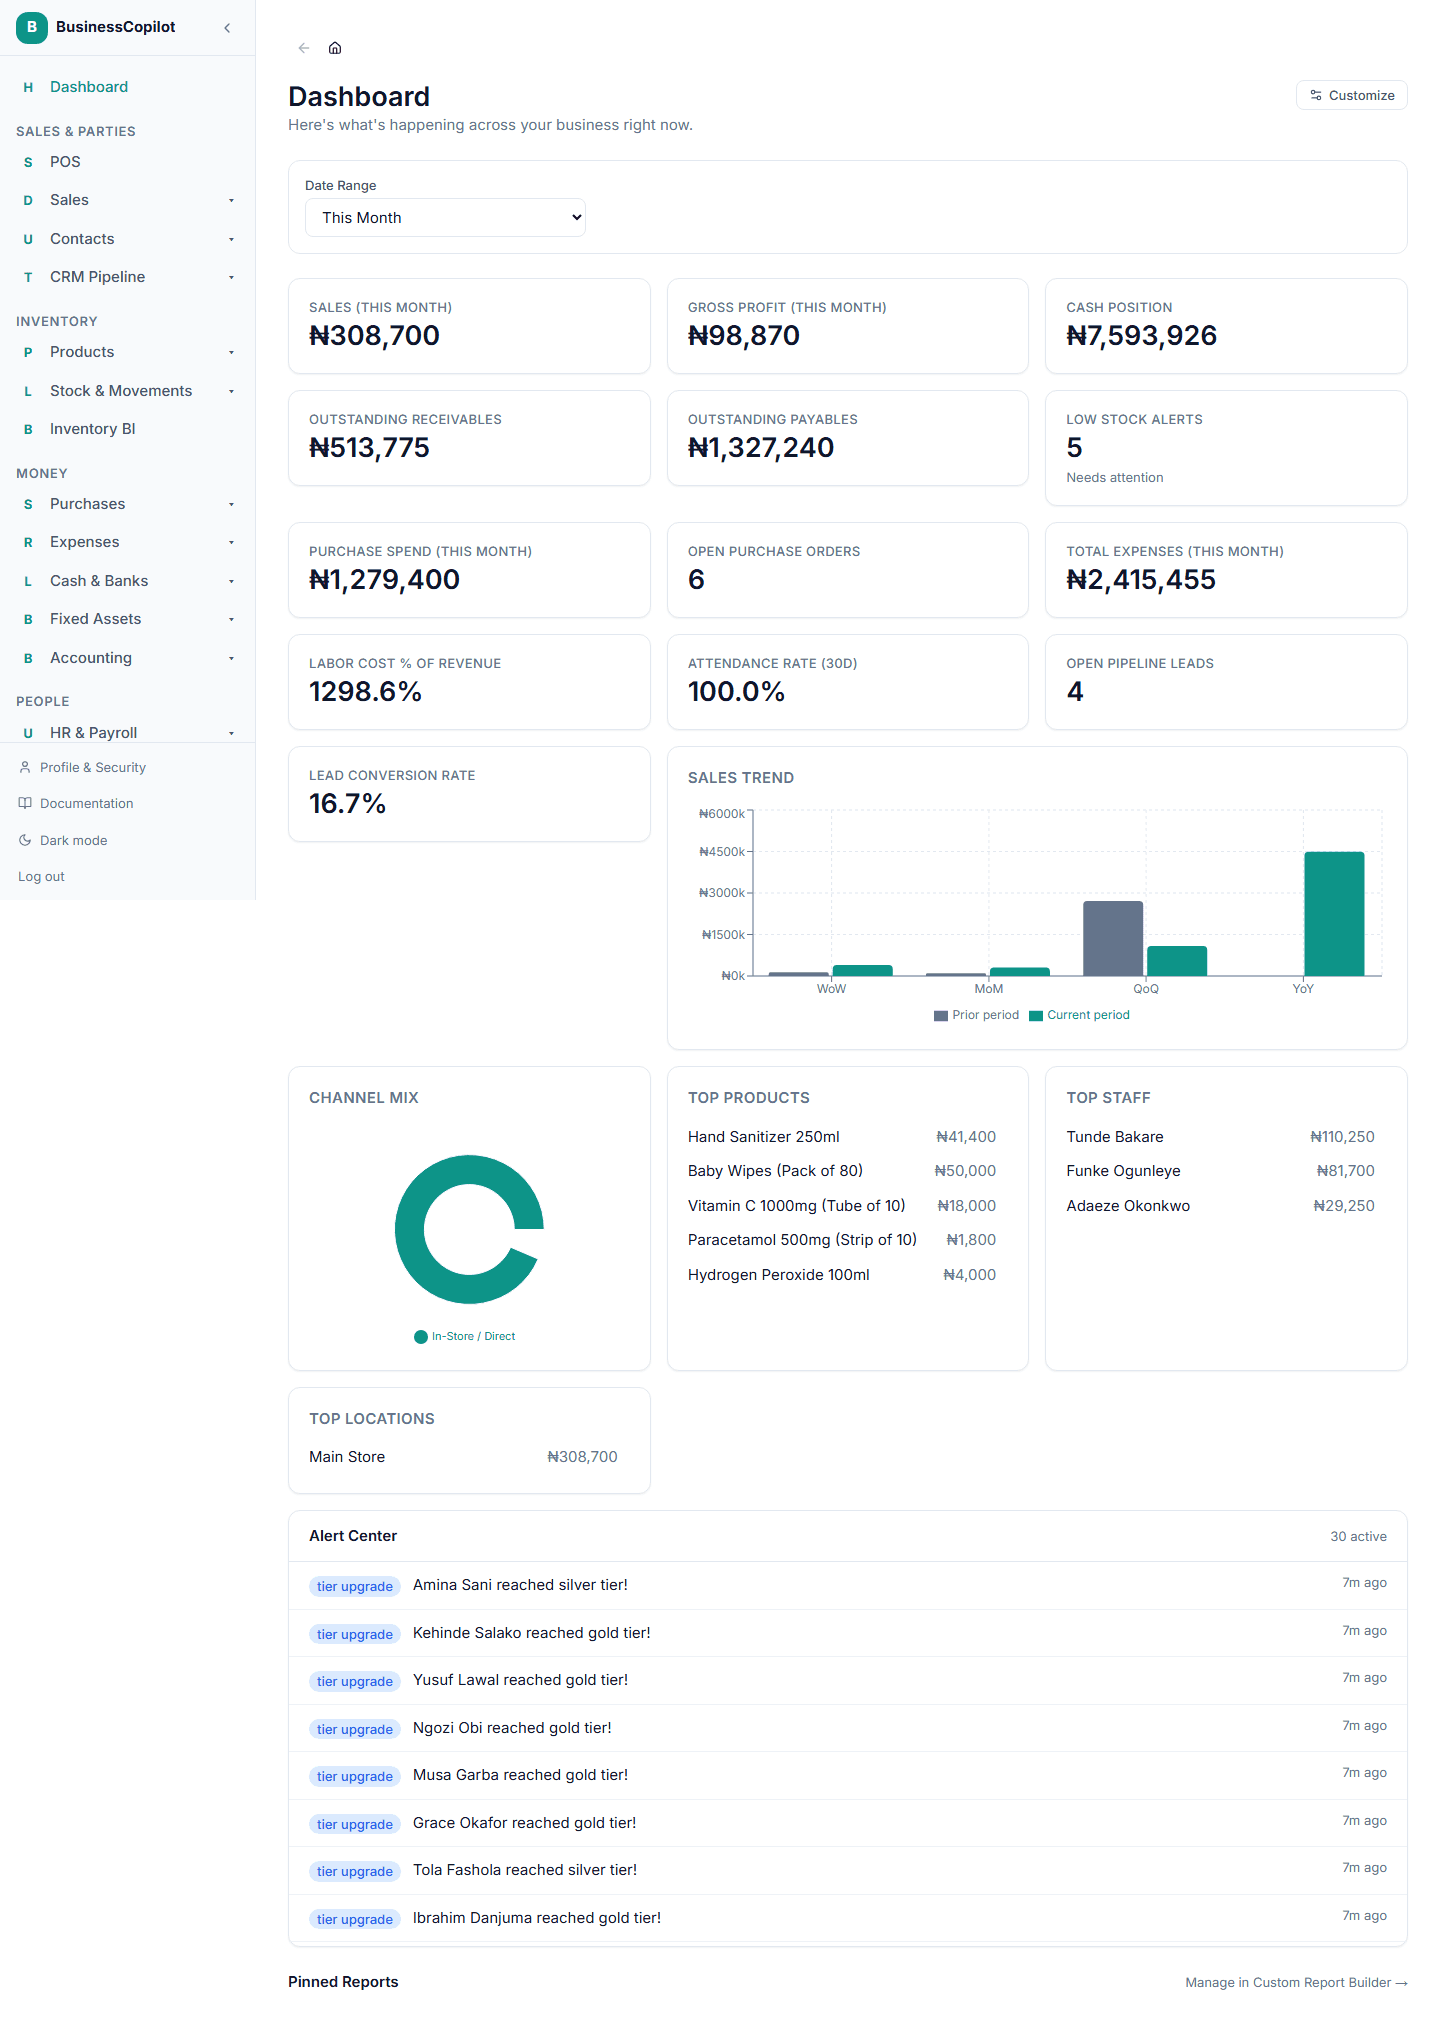
Open any saved report and select Pin to Dashboard. It'll then show up — live, not a snapshot — in a Pinned Reports section on your main Dashboard (the home page you land on after signing in), scoped to whatever date range you have set there. Select Pinned to Dashboard again (or the pin icon next to the report on the Dashboard itself) to unpin it.
This is a per-user preference — pinning a report only adds it to your own Dashboard, not anyone else's.