Understanding your Inventory dashboard
A live read on your stock health, dead stock, inventory value, movement, and product/category/brand performance.
Go to Stock → Intelligence (titled "Inventory BI" on screen). The page has four tabs: Overview, CEO Dashboard, Reports, and Performance.
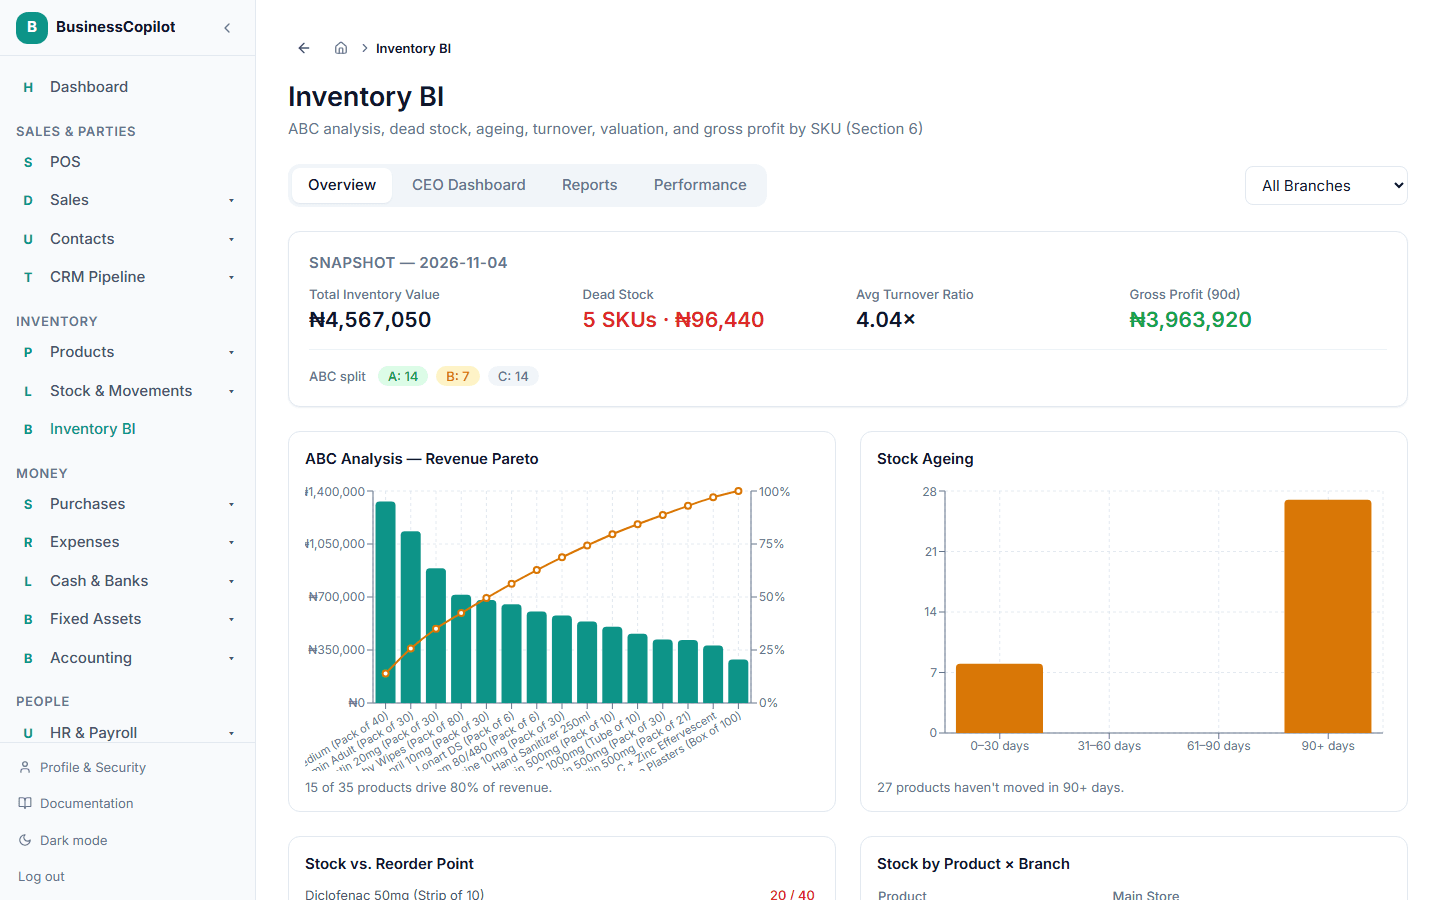
Overview
Classifies your products by how much they matter to your revenue, shows how long stock has been sitting since it last moved, and gives you a valuation of everything you're currently holding. This tab also has several charts you can select into for more detail:
- ABC Analysis — your products ranked by revenue, with a line showing which ones make up 80% of it. Useful for deciding what to prioritize when buying or promoting.
- Stock Ageing — how many products fall into each "haven't moved in X days" bucket.
- Stock vs. Reorder Point — at-a-glance bars showing which products are at or below their reorder level.
- Stock by Product × Branch (if you have more than one location) — a grid showing where stock is thin.
- Expiring Soon — batches approaching their expiry date.
CEO Dashboard
Rolls the Overview tab up into a higher-level summary — inventory value, cash tied up in stock, stock accuracy, and how healthy your inventory position is overall.
Reports
Live, date-ranged reports: Movement (stock in vs. out over time, with a chart), Variance (differences found during stock counts), and Damaged Goods — plus a Shrinkage by Category chart showing where write-offs and losses are concentrated.
Performance
Snapshot-based reports that always cover the trailing 90 days: Gross Margin by SKU, Category Performance, and Brand Performance (the last two shown as charts as well as a table).
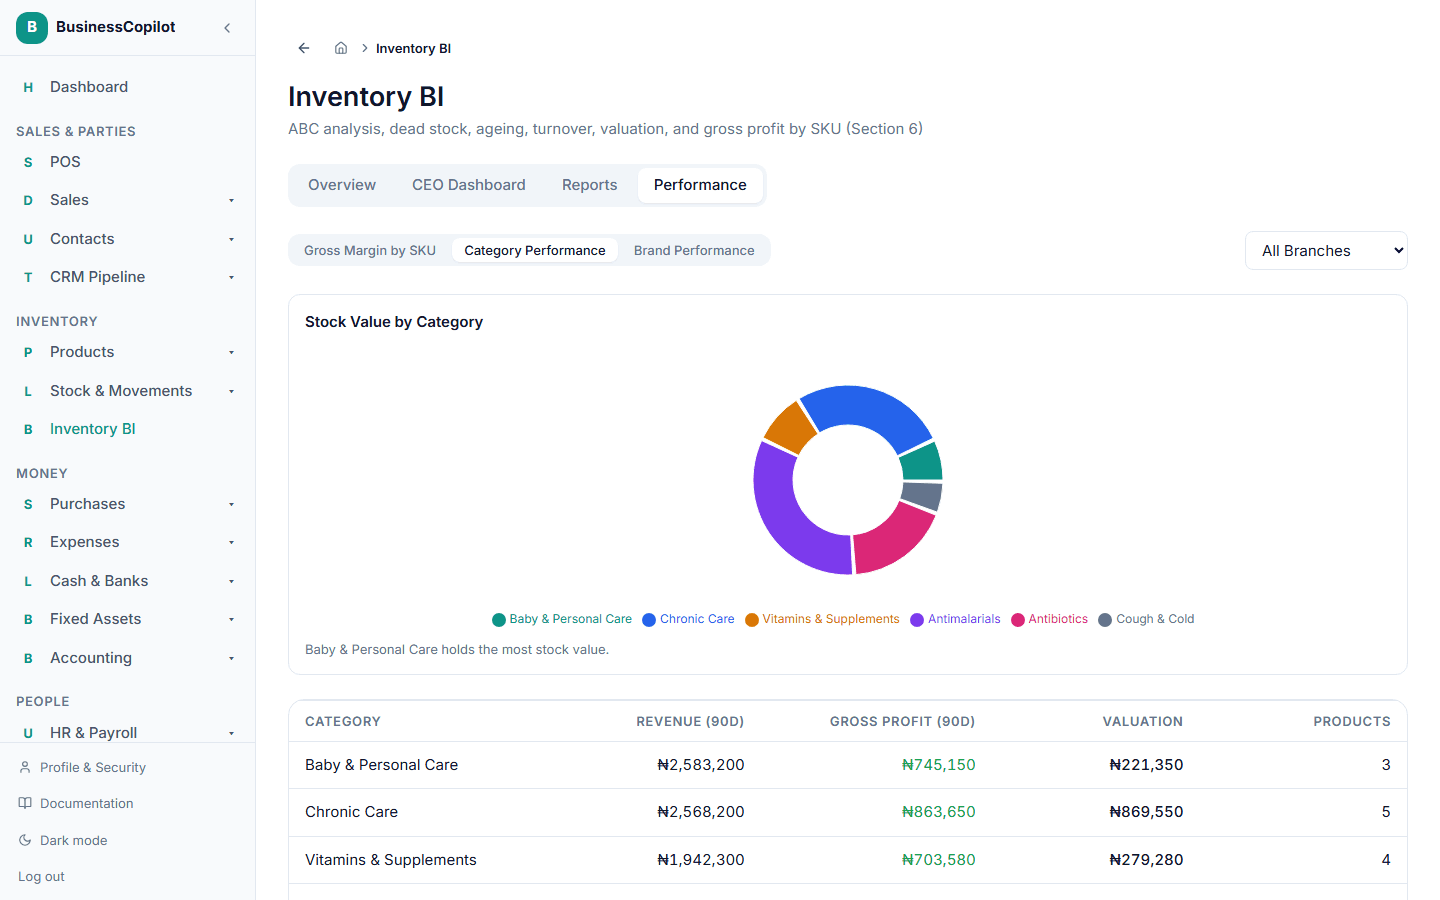
Every chart drills down
Select a bar or a slice on most of these charts to open a full page listing the real stock movements or sales behind that number — see Drilling into a number.
Filtering by location
If you have more than one location, use the location filter at the top of the Overview, CEO Dashboard, and Performance tabs to narrow everything on that tab down to a single branch. Reports has its own separate date range and location filter, since it covers different data.