Insights
See how your appointments are really going — missed and cancelled visits, how busy each provider is, your busiest times, and who to call.
Insights turns your appointments into a clear picture: how many patients come, how many don't, how full each provider's day is, and when you're busiest. It's read-only — nothing you do here changes an appointment.
Anyone with View on Patient Engagement (Appointments) can open it, and it only counts the branches they're allowed to see. Find it on the Insights tab of any Appointments page (Web and Desktop), or the Insights chip on the mobile app.
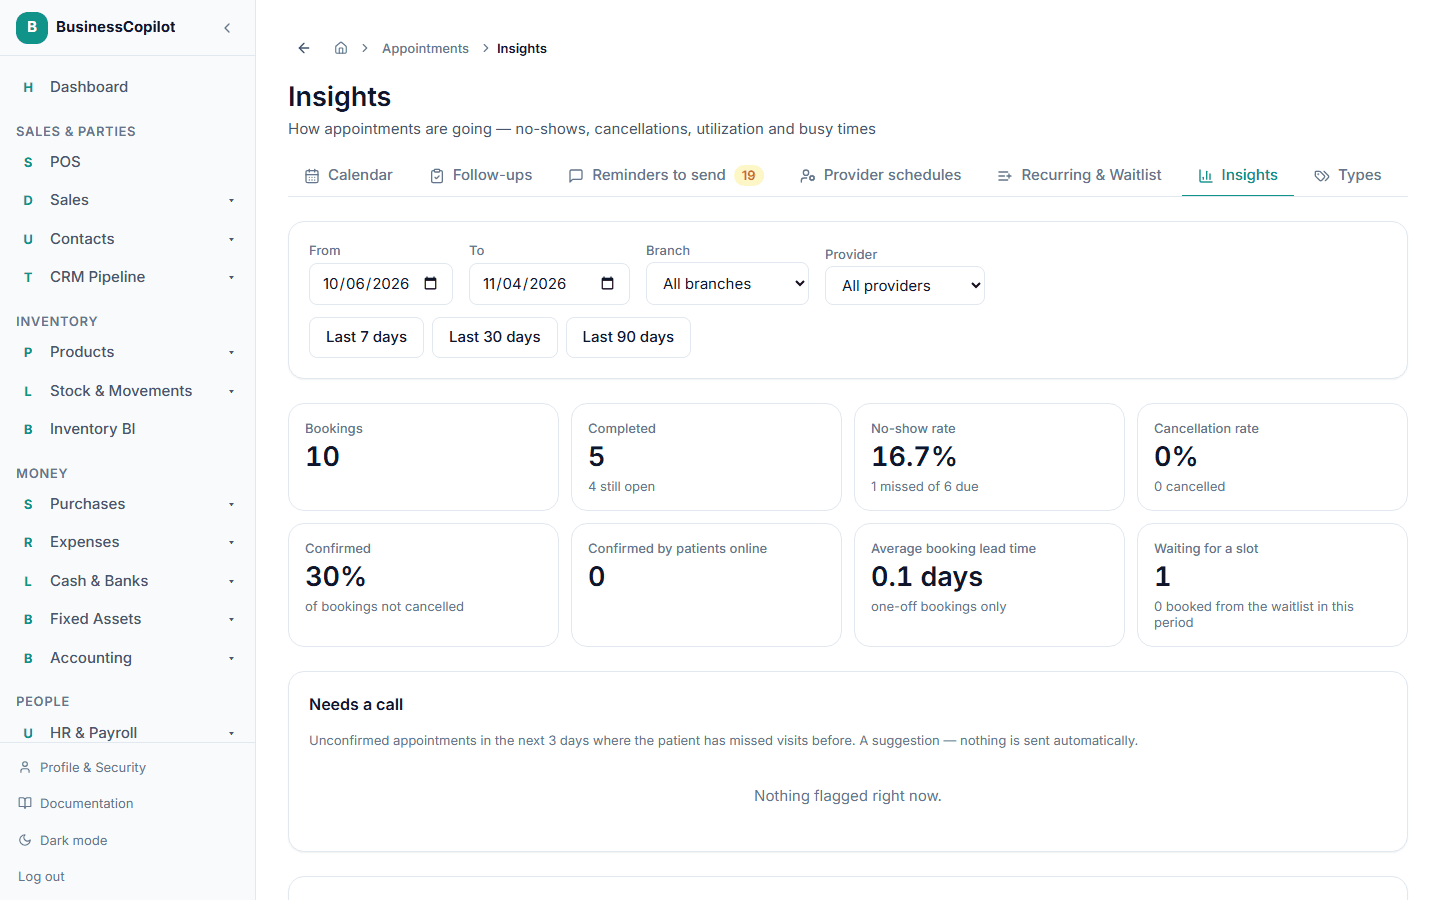
Choosing what to look at
At the top, choose the period and, if you like, narrow it down:
- From and To dates. They start on the last 30 days.
- The preset buttons Last 7 days, Last 30 days and Last 90 days (7 days / 30 days / 90 days on the mobile app).
- A Branch — or All branches.
- A Provider — or All providers.
The longest period you can look at is 366 days. The start date can't be after the end date.
Everything on the page follows what you choose. If nothing has happened in that period yet you'll see "No appointments in this period yet. Insights fill in as appointments are booked and completed." — a new workspace will start out empty.
The summary tiles
| Tile | What it means |
|---|---|
| Bookings | Appointments in the period. Rescheduled ones are not counted, because the new entry counts instead. |
| Completed | Visits that were completed, and how many are still open. |
| No-show rate | Of the visits that reached their time, the share the patient missed: missed ÷ (completed + missed). |
| Cancellation rate | Cancelled ÷ all bookings. |
| Confirmed | Of the bookings that weren't cancelled, the share that were confirmed. |
| Confirmed by patients online | How many patients confirmed through their link — and how many declined online. |
| Average booking lead time | How many days ahead, on average, appointments are booked. Recurring-series visits are left out, since they're all created together. |
| Waiting for a slot | Patients on the waitlist now, and how many were booked from it in this period. |
A dash (—) is not zero. If there's nothing to divide by — for example no visit has reached its time yet — a rate shows —, so you're never told "0% no-shows" when the truth is "we don't know yet".
An example
In two weeks a clinic has 20 bookings: 12 completed, 3 missed, 4 cancelled and 1 still ahead. The No-show rate is 3 ÷ (12 + 3) = 20%. The Cancellation rate is 4 ÷ 20 = 20%.
Needs a call
A list of appointments in the next 3 days that:
- haven't been confirmed yet, and
- belong to a patient with a high no-show risk.
Each shows the patient, the time, the provider, the reasons, and the risk label. Select one to open the appointment. It's a suggestion for who to phone — nothing is sent automatically. With none it says "Nothing flagged right now."
Provider utilization
For each provider, how much of their available time was booked — as a percentage and in hours and minutes, for example 62.5% · 5h of 8h.
- Available time is their working hours, minus breaks and time off.
- Booked time counts scheduled, confirmed, in-progress and completed appointments inside working hours. Cancelled and missed ones don't count.
- Two overlapping bookings are counted once, so a double-booked provider never shows more than 100%.
A provider without a schedule at a branch isn't measured there. With nobody set up it says "No provider schedules to measure yet — set them up under Provider schedules."
Busiest days and hours
Two bar charts: the number of bookings for each weekday (Sunday to Saturday) and for each hour of the day. Use them to plan staffing. They use Nigerian time — a booking at 00:30 counts as the early hours of its day, not the day before.
By provider and by appointment type
Two tables. For each provider, and each type of appointment (the built-in ones — Consultation, Medication review, Follow-up, Vaccination, Other — and any of your own), you see the number booked, done, missed and cancelled, and the no-show rate.
Tips for using it
- Look at 30 days or more. Small numbers swing wildly — one no-show out of four visits is 25%.
- Compare providers carefully. A provider who mostly sees high-risk patients may have a higher no-show rate for reasons that have nothing to do with them.
- Check busy hours before changing opening times. If nobody books before 10:00, that's worth knowing.
- Watch the confirmed rate after you start telling patients about the confirmation link.